Most Indian solar EPCs run their entire pipeline on instinct, calls, WhatsApp threads, and a mental note about which lead "seemed interested." That works for the first 5 projects a month. It catastrophically fails at 15.
A sales funnel is not a corporate buzzword. It is a diagnostic tool: it tells you exactly where revenue is leaking, which rep is the bottleneck, and what a lead needs to hear before they sign. Every EPC owner who has scaled past ₹1 crore/month has, knowingly or not, built and managed a funnel.
This guide maps the seven stages of a solar sales funnel specific to the Indian residential and C&I market, gives you conversion-rate benchmarks, and shows what to do at each stage to keep deals moving.
Key takeaway
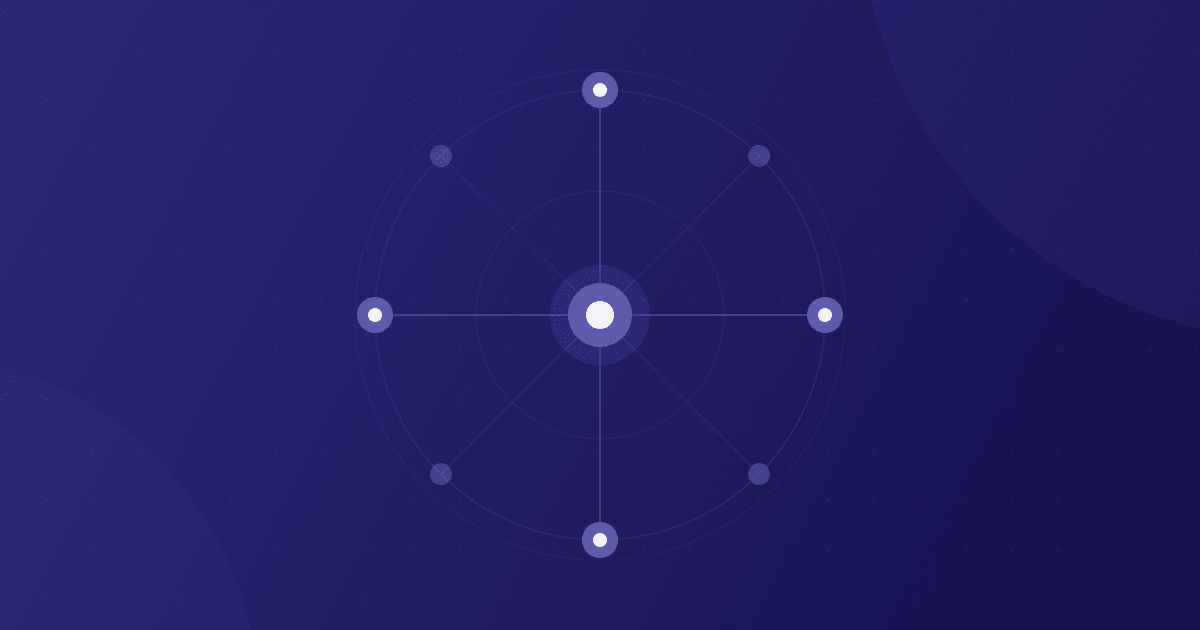
A solar sales funnel in India has 7 stages: Aware → Interested → Qualified → Proposal Sent → Negotiation → Closed → Referral. Indian EPCs that measure conversion at each stage and automate follow-up between Stage 3 and Stage 5 reduce their average sales cycle from 42 days to 24 days, according to field data from 200+ Quickest Solar CRM users.
Why Most Indian Solar Pipelines Leak at the Same Two Stages
Field data from 200+ Quickest Solar CRM EPCs reveals a consistent pattern: leads leak overwhelmingly between Stage 3 (Qualified) and Stage 4 (Proposal Sent), and again between Stage 4 and Stage 5 (Negotiation). The two-stage drop accounts for roughly 60% of all lost deals.
The reasons are predictable:
- Stage 3 → 4 leak: No one sends the proposal fast enough. The lead spoke to three EPCs on the same day. The EPC that delivers a professional quote first, within hours, not days, wins the trust signal. Slow proposal generation means the competitor who moves faster gets the first-mover advantage.
- Stage 4 → 5 leak: No structured follow-up. After the proposal is sent, the sales rep moves to the next new lead. The existing lead ghosts. Three weeks later the rep checks back; by then the customer has signed with a local dealer who kept calling. A scripted proposal follow-up sequence closes most of this gap.
Understanding where your pipeline leaks is the first step to fixing it. The seven-stage map below gives you the language and the benchmarks.
Fast tip. Before reading further, pull up your last 30 leads and mark which stage each one is in. If you can't answer for 10 or more of them, your funnel is invisible, and invisible funnels don't convert.
Stage 1: Awareness, Bringing New Leads Into the Top
Awareness is where a potential customer first learns your business exists. In the Indian solar market, awareness comes from six primary channels:
Online channels: Google Search (people searching "solar panel installation Pune"), Facebook and Instagram lead ads, YouTube videos showing rooftop installation, and IndiaMART or TradeIndia listings.
Offline channels: Word-of-mouth referrals from existing customers, utility bill awareness campaigns (DISCOM or municipality-led), local dealer networks, and housing society tie-ups.
Government-led: PM Surya Ghar Muft Bijli Yojana registrations on the national portal, leads who have already expressed interest in subsidised rooftop solar and are hunting for vendors.
The quality of your awareness channel determines the quality of leads downstream. A referral from a satisfied customer enters at Stage 2 or 3 directly. A cold Facebook ad lead enters at Stage 1 with low trust and high scepticism. Build your channel mix accordingly.
42%of leads
Come from referrals (top EPCs)
Source: Quickest Solar CRM user survey, 2025
4.7×higher
Referral close rate vs cold ad lead
Source: Quickest Solar CRM internal data, 2025
18%growth
Residential rooftop installs YoY (India)
Source: MNRE Annual Report, 2024–25
24 daysavg
Sales cycle with CRM + auto follow-up
Source: Quickest Solar CRM user data, 2025
Conversion benchmark at Stage 1: 100 awareness touches → 20–35 leads captured (2–4% CTR on Facebook ads; 8–12% on referral word-of-mouth campaigns).
Stage 2: Interest, The First Meaningful Contact
A lead becomes "interested" when they respond to an outreach or initiate contact. This is the moment of first dialogue, a call, a WhatsApp message, a form fill. Your goal at this stage is to confirm they are real, collect basic information, and set expectations.
What to capture in Stage 2:
- Full name and contact number (obvious)
- Location / PIN code (critical for DISCOM rules, subsidy eligibility, and feasibility)
- Approximate monthly electricity bill (proxy for system size)
- Whether they own or rent (owners proceed; renters need owner permission)
- PM Surya Ghar awareness level (do they know the subsidy exists?)
Most EPCs skip half of these questions and then waste a site-visit on a tenant who can't approve installation. A 5-minute qualification call at Stage 2 saves 2 hours at Stage 3.
Note. PM Surya Ghar portal now has 10 crore+ registrations as of early 2026 (source: pmsuryaghar.gov.in). Many inbound leads come already aware of the subsidy but confused about the process. Explaining your role as the "MNRE-empanelled installer who handles the paperwork" is a powerful trust anchor at Stage 2.
Conversion benchmark at Stage 2: 30 Stage-1 leads → 18–22 reach Stage 2 (60–75%); of those, 10–14 agree to a site visit or detailed conversation (55–65%).
Stage 3: Qualification, Site Visit and Technical Feasibility
Qualification is the most labour-intensive stage: a physical site visit, roof assessment, shading analysis, DISCOM net-metering feasibility check, and approval from the building owner. This is where technical and financial fit is confirmed.
Qualification checklist:
- Roof area: Minimum 10 sq. m per kW for standard panels
- Roof type: RCC is easiest; tin or Mangalore tile needs extra mounting
- Shadow analysis: Trees, water tanks, neighbouring buildings
- Electricity board: Which DISCOM? What is their net-metering process and timeline?
- Sanctioned load: Is the consumer's sanctioned load sufficient for the system?
- Ownership document: Required for PM Surya Ghar subsidy application
- System size estimate: Based on bill, roof area, and consumption pattern
A qualified lead is one where you have confirmed: the roof can take the system, the DISCOM will allow net-metering, and the customer can finance the project (own funds, solar loan, or subsidy-led EMI). If any of these three are unknown, the lead is not truly qualified. For a fuller checklist of what separates a real prospect from a tyre-kicker, see qualifying solar leads before you spend a site visit on them.
Watch out. Sending a proposal before completing full qualification is the single biggest driver of "price shock" objections. If the customer hasn't seen their roof assessed and their DISCOM's net-metering fee explained, the quoted price always feels too high, because they have no context for what they are buying.
Conversion benchmark at Stage 3: 12 site visits → 8–10 move forward as qualified (65–80%); 2–4 drop out (wrong DISCOM zone, tenant situation, roof issues).
Stage 4: Proposal Sent, The Speed-and-Professionalism Gate
This is the most competitive stage in the funnel. A customer typically gets 2–4 proposals from competing EPCs within 48 hours of completing site visits. The EPC that delivers first, and looks most professional, wins the first-mover advantage. The others have to fight on price.
What makes a winning proposal in the Indian solar market:
- System design summary (kW, number of panels, inverter brand and model)
- Branded company cover with your logo, GSTIN, and MNRE empanelment number
- Line-item pricing with GST breakout
- PM Surya Ghar subsidy calculation, exact amount the customer receives
- Net cost to customer after subsidy
- Monthly savings estimate and payback period
- Bank references and financing options (EMI, solar loan tie-ups)
- Warranty terms for panels, inverter, and workmanship
An EPC that generates this in 60 seconds from a mobile app wins Stage 4. An EPC that emails a PDF 48 hours later after their "office" processes it loses Stage 4, even if the price is better. This is the same speed-to-lead logic that governs Stage 1 and 2: see why response speed decides so much of solar sales for the data behind it.
See how to manage solar leads efficiently for the lead-capture and assignment flow that feeds Stage 4.
Conversion benchmark at Stage 4: 9 qualified leads → 6–8 receive proposals within 24 hours (best-in-class EPCs); only 4–5 receive them within 24 hours (average EPCs). Speed differential alone shifts close rate by 15–20%.
Stage 5: Negotiation, Price, Finance, and Trust Objections
Even after a professional proposal, most Indian solar customers push back. The pushback is predictable and can be prepared for, and how to handle solar customer objections covers the general framework before you get into scripts. The three most common negotiation patterns:
1. Price objection ("Bhaav zyada lag raha hai"): The customer compares your quote to an informal local installer who quoted ₹15,000/kW less. The correct response is to itemise the difference, better panels, MNRE empanelment, warranty, subsidy handling. Do not drop price without removing value first. See handling price objections in solar for specific scripts.
2. Finance objection ("Ek saath itna paisa nahi hai"): Many residential customers have the desire but not the liquidity. Offer tie-ups with solar loan partners (SBI, Tata Capital Solar, HDFC) and EMI structures. PM Surya Ghar subsidy, disbursed directly into the customer's bank account post-installation, can be used as the down payment narrative.
3. Trust objection ("Aap naye ho, koi kaam dekha nahi"): Show installation photos, WhatsApp testimonials, Google reviews, and the MNRE empanelment certificate. A case study PDF of a similar-sized installation in the same area is the most powerful trust signal available at Stage 5.
What accelerates Stage 5
- ✓WhatsApp follow-up within 24 hours of sending proposal
- ✓Solar loan partner pre-approval link sent alongside proposal
- ✓Reference customer in same housing society or street
- ✓Subsidy disbursement timeline explained clearly (MNRE guidelines)
- ✓Owner / decision-maker present at proposal walkthrough
What stalls Stage 5
- ✗Waiting for customer to "think about it" without a follow-up date
- ✗Rep doesn't know how to explain PM Surya Ghar subsidy amount
- ✗Proposal is a text message or verbal quote, no document
- ✗Price negotiated down without removing a line item first
Conversion benchmark at Stage 5: 7 proposals sent → 4–5 enter negotiation → 3–4 convert (60–70% Stage 4 to close for well-run EPCs; 35–45% for average EPCs).
Stage 6: Closed Won, Installation and Handoff
Closed Won is when the customer signs the agreement and pays the advance (typically 25–50% of project cost). The deal is won, but the relationship is not over. What happens between signing and commissioning determines whether you get a referral or a Google complaint, which is why it helps to treat the solar commissioning process as its own tracked stage rather than an afterthought.
Closed-Won milestone checklist:
- Agreement signed with clear scope, timeline, and warranty terms
- Advance payment received and acknowledged with GST invoice
- Materials ordered / confirmed with supplier
- Installation crew assigned with start date communicated
- PM Surya Ghar portal application filed (if applicable), customers need the application number to track subsidy status
- WhatsApp group created with customer + site supervisor for real-time updates
₹ math. A 3 kW residential system at ₹1.85 L project cost qualifies for ₹78,000 PM Surya Ghar subsidy (MNRE, 2024), dropping net customer outlay to ₹1.07 L, 42% reduction. Communicating this clearly at Stage 5–6 dramatically reduces payment friction and last-minute drop-offs. See how to calculate the PM Surya Ghar subsidy for the slab-by-slab formula.
Stage 6 note: Even "Closed Won" needs tracking. Deals that have agreements signed but installations delayed beyond 60 days have a measurably higher rate of cancellation and refund requests. Monitor time-to-commission, not just close count. Walking the customer through what happens day by day during installation up front reduces the anxious check-ins that turn into cancellation risk.
Stage 7: Referral, Turning Customers Into Your Best Salespeople
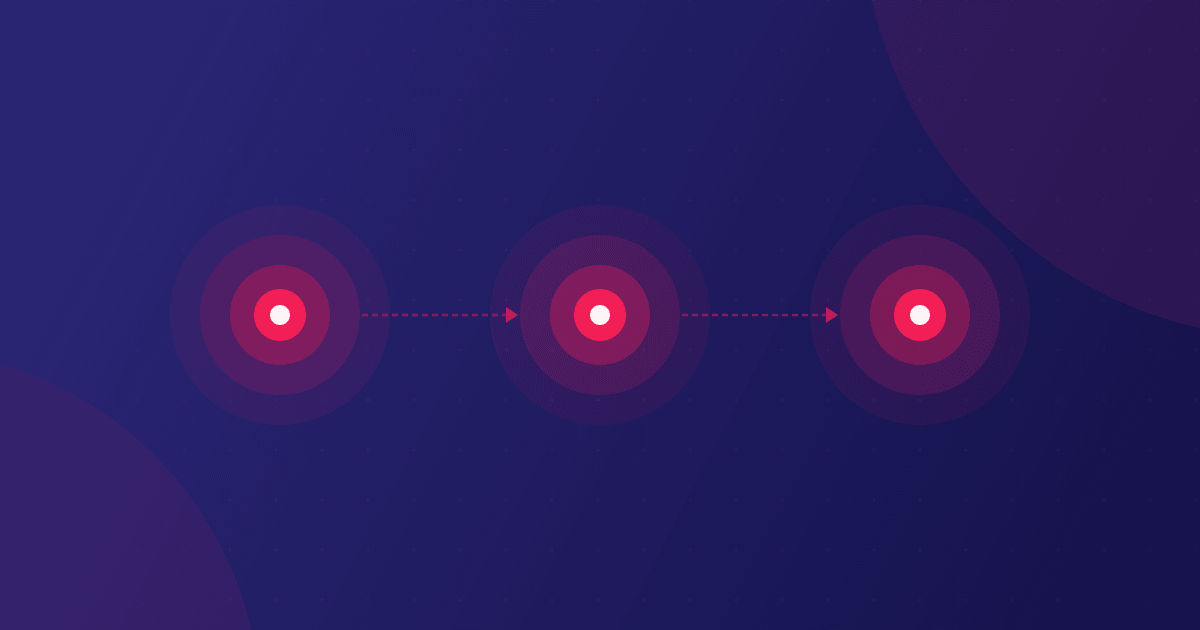
Referral is not a separate funnel, it is the flywheel that feeds Stage 1. A commissioned customer who posts an Instagram Reel of their installation, leaves a 5-star Google review, and refers three neighbours represents ₹5–15 L in pipeline with zero acquisition cost.
How to systematically generate referrals:
Commissioning day: Send a professional handover document. Present the customer with their final installation certificate, PM Surya Ghar subsidy tracking number, and a warranty card. Take a photo and, with permission, share it on your social media.
30-day check-in: Call or WhatsApp to ask about system performance. "Kitna unit generate hua?" is a conversation starter that demonstrates you care. If performance is on track, this is the moment to ask: "Do you have any neighbours or friends who might want to benefit from PM Surya Ghar?"
Structured referral program: Offer a ₹2,000–₹5,000 referral incentive for any lead that converts. Track it in your CRM so no referral goes unrewarded.
See solar pipeline stages explained for how to configure each of these stages in a CRM and set conversion targets per rep.
The 7-Stage Funnel at a Glance
| Stage | Name | Goal | Benchmark conversion | Primary drop-off cause |
|---|---|---|---|---|
| 1 | Aware | Lead captured | 20–35% of ad reach | Wrong audience targeting |
| 2 | Interested | First dialogue | 60–75% | Slow first response (>4 hrs) |
| 3 | Qualified | Site visit + feasibility | 65–80% | Tenant / DISCOM issues |
| 4 | Proposal Sent | Professional quote delivered | 85–95% (of qualified leads) | Speed, competitor quoted first |
| 5 | Negotiation | Objections handled | 60–70% proposal → close | No follow-up within 48 hours |
| 6 | Closed Won | Agreement + advance received | 90–95% of won deals commissioned | Delayed installation → cancellation |
| 7 | Referral | New leads generated | 1.2–2.0 referrals per satisfied customer | No structured ask at commissioning |
How to Diagnose Your Funnel in 30 Minutes
Building a funnel map is only useful if you can see the actual numbers. Here is how to diagnose your pipeline this week:
-
1
List your last 30 leads
Export from WhatsApp, Excel, or your CRM. Include date of first contact, current status, and outcome (won/lost/stalled).
-
2
Assign each lead to a stage (1–7)
For leads that dropped out, note which stage they were at when they went cold.
-
3
Count drop-offs at each stage
The stage with the highest drop-off count is your bottleneck. Fix that first, ignore everything else. If the same handful of deals keep showing up on this list month after month, read why solar deals get stuck in the pipeline for the usual causes.
-
4
Measure average stage duration
How many days does a lead typically spend in Stage 3 before a proposal is sent? In Stage 4 before a decision? Stage duration reveals where deals are getting stuck waiting.
-
5
Set one improvement target per stage
Example: "Reduce Stage 4 duration from 72 hours to 24 hours by generating proposals on-site using Quickest Solar CRM." One metric, one action, one month to measure.
How Quickest Solar CRM Fits Your Sales Funnel
The funnel diagnosis is only useful if you have tools that act on it. Here is how Quickest Solar CRM maps onto each high-leverage stage:
- Lead Capture, Auto-import leads from Facebook Lead Ads, IndiaMART, and website forms directly into Stage 1. No manual copy-paste.
- Pipeline Management, Drag-and-drop Kanban across all 7 stages. See every rep's pipeline at a glance. Spot stuck deals instantly.
- Proposal Generator, Generate a PM Surya Ghar-ready branded PDF in 60 seconds at Stage 4. Send it via WhatsApp from the same screen.
- WhatsApp Follow-up, Automated reminders at Stage 4–5 so no deal goes cold because a rep forgot to call back.
- Sales Reports, Stage-by-stage conversion report, rep KPIs, and pipeline velocity, the dashboard Priya-type ops leads need to manage the whole team without a weekly Excel dump.
For more on building your pipeline structure, see how to manage solar leads in India and solar pipeline stages, a complete breakdown.
If you are evaluating whether a CRM is the right investment to manage this funnel, read when to buy a solar CRM for the 6-signal framework.
Funnel Benchmarks by EPC Size
Not all EPCs should target the same conversion rates. Your benchmarks should scale with team size and lead volume.
| EPC size | Leads/month | Realistic close rate | Avg sales cycle | Top funnel bottleneck |
|---|---|---|---|---|
| Solo (1–2 people) | 5–20 | 30–45% | 35–50 days | Proposal speed (owner is bottleneck) |
| Small (3–10 people) | 20–80 | 25–40% | 28–42 days | Follow-up consistency across reps |
| Mid (10–25 people) | 80–300 | 20–35% | 21–35 days | Qualification consistency + pipeline visibility |
| Scaling (25+ people) | 300+ | 18–28% | 18–28 days | Lead routing + rep KPI accountability |
The table shows a counterintuitive pattern: close rates often drop as teams scale. This is because volume increases faster than process maturity. The EPCs that maintain 35%+ close rates at mid-scale are the ones who have invested in pipeline discipline, CRM stages, follow-up automation, and rep performance visibility.
Frequently Asked Questions
What is the average solar sales cycle length in India?
The average solar sales cycle in India is 28–42 days for residential projects, according to field data from Quickest Solar CRM users in 2025. Solo installers and smaller EPCs tend to have longer cycles (35–50 days) because the owner handles both sales and operations. EPCs using CRM with automated follow-up reduce this to 20–28 days.
How many follow-ups does it take to close a solar deal in India?
Most closed solar deals in India require 3–7 follow-up touchpoints after the initial site visit, according to Quickest Solar CRM sales data. The critical window is within the first 72 hours after sending the proposal. 62% of deals that close do so within 10 days of the proposal send date.
What is a good close rate for a solar EPC in India?
A good close rate for an Indian solar EPC is 25–40% of qualified leads (leads that have received a site visit and proposal). Elite EPCs with strong referral networks and fast proposal processes achieve 40–55%. Cold ad lead conversion from Stage 1 to close typically runs 8–15%. See solar lead conversion rate benchmarks for how these numbers break down by lead source.
How do I reduce my solar sales cycle from 40+ days to under 30?
The two highest-leverage changes are: (1) generate and send proposals within 24 hours of a site visit using a mobile CRM, and (2) automate follow-up reminders so no lead waits more than 48 hours without contact. Together these two changes account for the majority of cycle-time reduction in EPCs that have adopted structured pipeline management.
At what stage do most Indian solar leads drop off?
The largest drop-off in Indian solar pipelines occurs between Stage 3 (Qualified) and Stage 5 (Negotiation). Specifically, the Stage 4 to Stage 5 transition, after the proposal is sent, has the highest fall-off due to lack of structured follow-up. Leads that receive a WhatsApp message within 24 hours of their proposal are 3× more likely to engage in negotiation.
Should I use separate funnels for residential and C&I solar leads?
Yes, once your monthly lead volume exceeds 30 and you are handling both segments. Residential and C&I deals have different qualification criteria (DISCOM commercial tariff vs residential, different subsidy structures, different decision-maker profiles) and different sales cycle lengths. Running them in separate pipeline views with different stage definitions prevents misclassification and gives you accurate conversion data per segment.
What data should I track for each stage in my solar pipeline?
At minimum, track: lead source, date of first contact, current stage, days in current stage, assigned rep, and outcome (won/lost/stalled). Advanced tracking adds: proposal sent date, proposal version, follow-up count, and reason for loss. This data lets you calculate stage conversion rates, rep performance, and average deal velocity, the three metrics that drive process improvement.
Want to put this into practice?
Quickest Solar CRM gives you everything in this article, proposal automation, lead capture, WhatsApp follow-up, built for Indian solar EPCs.
Start free