Choosing the right CRM dashboard can make or break your solar business’s sales performance. In 2026, solar companies across India are discovering that the difference between hitting targets and missing opportunities often comes down to one critical factor: having real-time visibility into what’s actually happening in their sales pipeline.
A powerful CRM dashboard transforms raw sales data into actionable insights, helping solar EPCs, installers, and sales teams make smarter decisions faster. Yet many solar businesses struggle with dashboards that either overwhelm them with unnecessary data or fail to show the metrics that truly matter for closing deals and growing revenue.
This comprehensive buyer’s guide walks you through everything you need to evaluate CRM dashboard capabilities for your solar business. You’ll discover which analytics features drive results, what questions to ask vendors, and how to choose a dashboard that empowers your team rather than confuses them.
Why Your Solar Business Needs a Powerful CRM Dashboard
The solar industry moves fast. Leads come in from multiple sources, proposals need to go out within hours, and competitors are constantly vying for the same customers. Without a centralized CRM dashboard providing real-time visibility, your sales team is essentially flying blind.

Modern solar businesses face unique challenges that generic spreadsheets and basic tools simply can’t address. When you’re managing dozens of leads simultaneously, tracking proposal acceptance rates, and coordinating field sales teams across different territories, you need instant access to critical performance data.
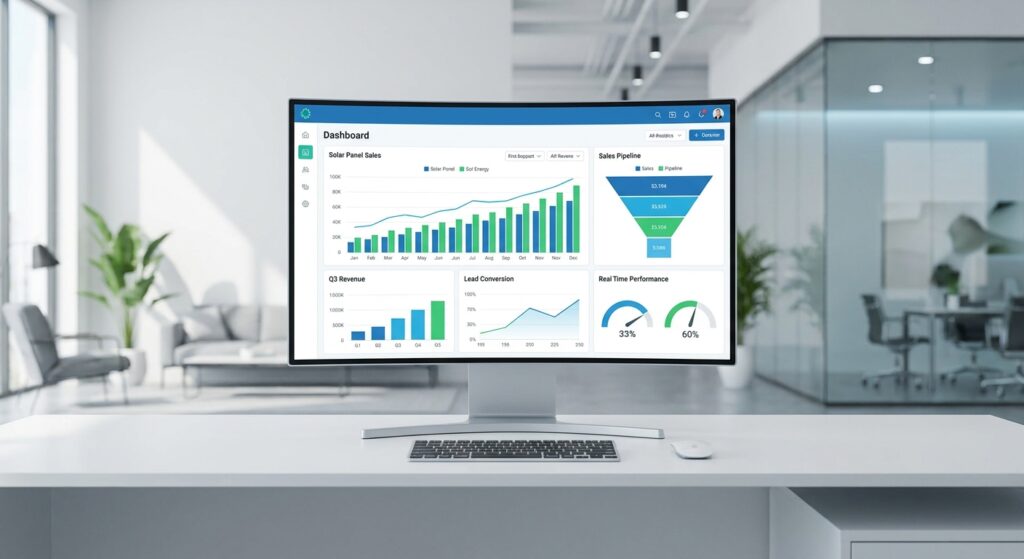
A well-designed dashboard serves as your sales command center. It shows you which leads are hot, which team members need support, where bottlenecks are forming in your pipeline, and whether you’re on track to hit monthly targets. This real-time visibility enables proactive decision-making rather than reactive firefighting.
The pain points of poor dashboard design are costly. Sales managers waste hours compiling manual reports instead of coaching their teams. Field sales representatives miss follow-up opportunities because they can’t quickly see which prospects need attention. Leadership struggles to forecast revenue accurately without reliable pipeline data. These inefficiencies directly impact your bottom line.
What separates basic reporting from strategic dashboard capabilities? Basic reports tell you what happened last week or last month. Strategic dashboards show you what’s happening right now and help you predict what’s likely to happen next. They surface patterns, highlight anomalies, and guide your team toward high-value activities that actually close deals.
1. Understand Core CRM Dashboard Components
Before evaluating specific vendors, you need to understand the fundamental components that make a CRM dashboard effective for solar businesses. These core elements work together to give you comprehensive visibility into your sales operations.
Real-time sales tracking and pipeline visualization form the foundation of any quality dashboard. Your dashboard should display your entire sales pipeline at a glance, showing how many leads are in each stage, from initial contact through proposal sent to deal closed. Visual pipeline representations using funnel charts or kanban-style boards help you instantly identify where deals are stalling.
For solar companies, this means seeing exactly how many site assessments are scheduled, how many proposals are pending customer review, and how many contracts are awaiting signatures. When your dashboard updates in real-time, you can respond immediately when a high-value prospect moves forward or when a deal gets stuck.
Lead source analytics and attribution tracking answer a critical question: where are your best customers coming from? Your dashboard should break down lead sources, showing which channels deliver the highest volume and, more importantly, the highest conversion rates. Are Facebook Ads generating quality solar leads? Is your website contact form outperforming trade show contacts?
Understanding lead source performance helps you allocate marketing budgets more effectively and double down on channels that actually drive revenue. This is especially valuable for solar businesses operating in competitive markets where customer acquisition costs directly impact profitability.
Team performance metrics and activity monitoring give sales managers visibility into individual and team productivity. Your dashboard should track key activities like calls made, proposals sent, follow-ups completed, and meetings scheduled. This isn’t about micromanaging; it’s about identifying top performers whose strategies can be replicated and supporting team members who might need additional training or resources.
Conversion rate tracking across sales stages reveals where your sales process is strongest and where it’s breaking down. A comprehensive dashboard shows conversion rates between each pipeline stage. You might discover that 80% of site assessments lead to proposals, but only 20% of proposals convert to signed contracts. This insight tells you exactly where to focus improvement efforts.
Revenue forecasting and goal tracking features help you plan for growth and hold teams accountable. Your dashboard should display progress toward monthly and quarterly targets, projected revenue based on current pipeline, and historical performance trends. For solar businesses with seasonal fluctuations, these forecasting tools are essential for managing cash flow and resource planning.
Key Metrics Every Solar CRM Dashboard Should Display
While every solar business has unique priorities, certain metrics are universally valuable for tracking sales performance and business health.
- Lead-to-customer conversion rates: The percentage of new leads that ultimately become paying customers. This master metric reflects the overall health of your sales process.
- Average deal size and sales cycle length: Understanding typical project values and how long deals take to close helps with accurate forecasting and capacity planning.
- Proposal acceptance rates: The percentage of proposals that convert to signed contracts. Low acceptance rates might indicate pricing issues, proposal quality problems, or targeting the wrong prospects.
- Follow-up response times: How quickly your team responds to new leads and follows up after sending proposals. Speed matters enormously in solar sales, where prospects often contact multiple installers simultaneously.
- Team activity and productivity scores: Metrics tracking daily activities like calls, emails, and meetings completed. High activity levels from top performers establish benchmarks for the entire team.
The best dashboards don’t just display these metrics in isolation. They show relationships and trends, helping you understand how improving one metric (like follow-up response time) impacts others (like conversion rates). This is where proven strategies to boost sales conversion become measurable and trackable.
2. Evaluate Data Visualization Capabilities
Numbers in spreadsheets are hard to interpret quickly. Effective data visualization transforms complex sales data into intuitive visual formats that your brain can process instantly. When evaluating CRM dashboard options, pay close attention to how information is presented visually.

Types of charts and graphs that matter for solar sales include funnel charts for pipeline visualization, line graphs for trend analysis over time, bar charts for comparing team performance, and pie charts for lead source distribution. The dashboard should automatically select appropriate visualization types for different data sets.
For solar businesses, geographic heat maps can be particularly valuable, showing where your customers are concentrated and identifying underserved territories with growth potential. Project status dashboards using color-coded cards help field teams quickly see which installations are on schedule and which need attention.
Customizable widgets and dashboard layouts ensure that each team member sees the information most relevant to their role. Sales representatives need different views than sales managers, who need different views than company executives. Look for dashboards that allow users to arrange, resize, and configure widgets to match their workflow.
The ability to create multiple dashboard views is essential. You might want a high-level executive dashboard showing monthly revenue and conversion rates, a sales manager dashboard focused on team activities and pipeline health, and a field sales dashboard highlighting today’s follow-ups and upcoming appointments.
Mobile-responsive dashboard design is non-negotiable in 2026. Solar sales teams spend significant time in the field conducting site assessments and meeting with customers. Your dashboard must be fully functional on smartphones and tablets, with touch-optimized interfaces that don’t require zooming or horizontal scrolling.
Color-coding and visual alerts for priority items help your team focus on what matters most. Deals that haven’t been touched in several days should stand out visually. High-value prospects should be highlighted differently than small residential projects. Overdue follow-ups need immediate visual prominence.
Drill-down capabilities for detailed analysis let you start with high-level overview metrics and click through to underlying details. If your dashboard shows that conversion rates dropped last month, you should be able to drill down to see which lead sources, team members, or project types drove that decline.
3. Assess Real-Time Reporting and Analytics Features
Real-time data access separates modern CRM dashboards from legacy systems that require manual data entry and overnight batch processing. Understanding the reporting capabilities of potential CRM solutions is crucial for making an informed decision.
Live data updates versus scheduled refresh cycles make a significant difference in operational responsiveness. True real-time dashboards update instantly when a sales representative logs a new lead, sends a proposal, or closes a deal. Some systems only refresh every hour or require manual refreshing, which can lead to decisions based on outdated information.
For solar businesses where multiple team members are updating lead statuses throughout the day, real-time synchronization ensures everyone is working with current information. This prevents duplicate follow-ups and ensures hot leads get immediate attention.
Automated report generation and scheduling saves countless hours of manual work. Your CRM dashboard should allow you to create custom reports once and then schedule them to generate and email automatically. Weekly pipeline reports can go to sales managers every Monday morning. Monthly performance summaries can go to executives on the first of each month.
This automation ensures consistent reporting without requiring someone to remember to compile and send reports manually. It also standardizes reporting formats, making period-to-period comparisons easier and more reliable.
Export capabilities in multiple formats provide flexibility for further analysis and sharing. Look for dashboards that can export data to PDF for client-ready reports, Excel for detailed analysis, and CSV for importing into other systems. The export process should be simple and preserve formatting and visualizations.
Historical data comparison and trend analysis help you understand performance patterns over time. Your dashboard should make it easy to compare this month’s metrics to last month, this quarter to last quarter, or this year to last year. Trend lines showing whether key metrics are improving or declining provide valuable context.
For solar businesses, seasonal patterns are important to track. Understanding that Q4 typically sees lower conversion rates helps you set realistic targets and avoid panic when performance dips predictably. Historical data also helps you measure the impact of process changes and training initiatives.
Custom report builder functionality empowers users to create specialized reports without requiring technical expertise or vendor support. A good report builder uses drag-and-drop interfaces where you select the metrics, filters, and visualization types you want. This flexibility is essential because every solar business has unique reporting needs that out-of-the-box reports might not address.
Report Types Solar Businesses Need Most
While custom reporting is valuable, certain standard reports should be available immediately without configuration:
- Daily sales activity reports: Summary of calls made, proposals sent, meetings held, and deals closed each day. This keeps teams accountable and helps managers spot productivity issues quickly.
- Weekly pipeline health reports: Overview of pipeline movement, new leads added, deals advanced, and deals lost. This weekly snapshot helps sales managers coach effectively and identify bottlenecks.
- Monthly revenue and conversion reports: Comprehensive analysis of closed deals, revenue generated, and conversion rates across all pipeline stages. Essential for performance reviews and strategic planning.
- Lead source ROI analysis: Breakdown of customer acquisition costs and revenue by lead source. This report guides marketing budget allocation and helps you eliminate underperforming channels.
- Team performance comparisons: Side-by-side comparison of individual sales representative metrics. Useful for identifying top performers and supporting struggling team members, but should be used constructively rather than punitively.
Implementing effective follow-up automation becomes much easier when your dashboard clearly shows which leads need attention and when.
4. Check Integration and Data Consolidation Options
Your CRM dashboard is most powerful when it consolidates data from all your sales and marketing tools into a single unified view. Fragmented data across multiple systems creates blind spots and requires manual work to piece together the complete picture.
Integration with lead generation sources ensures that every prospect is automatically captured in your CRM dashboard. Direct connections to Facebook Ads, Google Ads, your website contact forms, and landing pages mean leads flow into your system instantly without manual data entry.
For solar businesses running multiple marketing campaigns simultaneously, this automated lead capture is essential. When a prospect fills out a solar quote request form on your website at 10 PM, it should appear in your CRM dashboard immediately, ready for follow-up first thing the next morning.
Connection to communication tools like WhatsApp, email, and SMS platforms creates a complete activity record. When your CRM integrates with these tools, every message sent and received is logged automatically. This provides valuable context when team members need to pick up conversations with prospects.
In the Indian solar market, WhatsApp integration is particularly valuable since many customers prefer communicating through this channel. Being able to send proposals via WhatsApp directly from your CRM and track whether they’ve been opened creates a seamless workflow.
API access for custom integrations future-proofs your CRM investment. Even if a specific integration isn’t available out-of-the-box, robust API documentation allows developers to build custom connections to your other business systems. This is important for solar companies using specialized design software, accounting systems, or project management tools.
Data import capabilities from existing systems make migration from your current tools much easier. Look for CRM dashboards that can import lead data from Excel spreadsheets, export files from other CRMs, and various database formats. Clean import processes with field mapping and duplicate detection save enormous time during implementation.
Unified dashboard view across multiple data sources is the ultimate goal of integration. Your ideal CRM dashboard should display lead source data from your marketing tools, communication history from email and WhatsApp, proposal status from your quoting system, and revenue data from your accounting software all in one place.
This unified view eliminates the need to switch between multiple applications to understand a customer’s complete journey. Sales representatives can see everything they need to know about a prospect without leaving the dashboard.
5. Test Customization and Personalization Features
No two solar businesses operate identically, and no two team members have identical information needs. The best CRM dashboard solutions offer extensive customization options that adapt to your unique workflows and preferences.
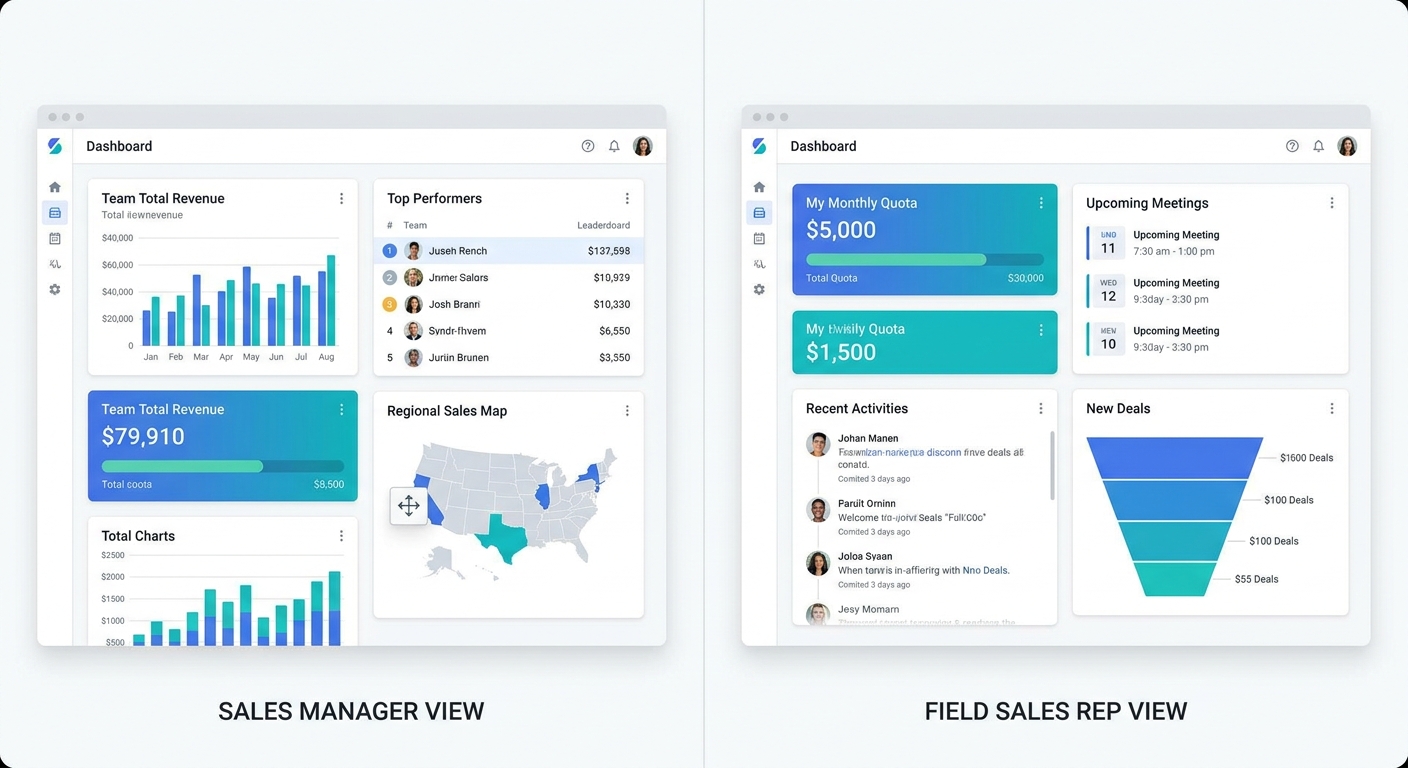
Role-based dashboard views for different team members ensure everyone sees relevant information without clutter. A field sales representative needs quick access to today’s appointments, pending follow-ups, and their personal pipeline. A sales manager needs team-wide metrics, performance comparisons, and pipeline forecasts. An executive needs high-level revenue trends and strategic KPIs.
Quality CRM systems allow you to configure default dashboard views for each role, while still giving individuals the flexibility to customize their personal workspace. This balance between standardization and personalization maximizes both consistency and user adoption.
Custom KPI creation and tracking lets you measure what matters most to your specific business. While standard metrics like conversion rates and deal values are universally useful, you might have unique KPIs specific to solar sales. Perhaps you track the percentage of proposals that include battery storage, or the average time from site assessment to proposal delivery.
Your CRM dashboard should allow you to define custom calculated fields and display them prominently alongside standard metrics. This flexibility ensures your dashboard reflects your business priorities, not just generic sales metrics.
Personalized goal setting and progress monitoring keeps teams motivated and accountable. Individual sales representatives should be able to see their personal targets and track progress in real-time. Visual progress indicators like thermometer charts or percentage-complete rings make goals tangible and create healthy competition.
For solar businesses with team-based incentives, the dashboard should also display team goals and collective progress. This transparency fosters collaboration and helps team members support each other in reaching shared objectives.
Saved filter and view preferences eliminate repetitive work. If you frequently need to view only high-value commercial solar leads in a specific territory, you should be able to save that filtered view and access it with a single click. Power users often create dozens of saved views for different scenarios and workflows.
White-label or branded dashboard options matter for solar companies that want to maintain consistent branding across all their tools. Some CRM systems allow you to customize colors, logos, and even domain names to match your company identity. While this is less critical than functional features, it contributes to a professional, cohesive experience.
6. Verify Mobile Access and On-the-Go Analytics
Solar sales teams don’t work exclusively from office desks. Site assessments, customer meetings, and installation oversight happen in the field. Your CRM dashboard must be fully functional on mobile devices to support this reality.
Mobile app dashboard functionality should mirror the capabilities of the desktop version, not offer a watered-down subset of features. Sales representatives in the field need to view their pipeline, update lead statuses, send proposals, log activities, and check performance metrics from their smartphones.
Native mobile apps for iOS and Android typically offer better performance and offline capabilities than mobile web browsers. However, the mobile web version should still be fully functional for team members who prefer not to install additional apps.
Responsive web dashboard design automatically adapts to different screen sizes and orientations. Charts and tables should reformat intelligently for smaller screens rather than requiring horizontal scrolling. Touch targets should be appropriately sized for finger taps rather than mouse clicks.
Push notifications for critical metrics keep field teams informed without requiring them to constantly check the dashboard. Notifications might alert sales representatives when a prospect opens their proposal, when a high-value lead is assigned to them, or when they’re falling behind on daily activity goals.
Configurable notification settings are important because notification overload quickly leads to users disabling them entirely. Team members should be able to choose which events trigger notifications and whether they receive them via push notification, email, or SMS.
Offline access capabilities ensure productivity doesn’t stop when internet connectivity is unreliable. While real-time synchronization is ideal, mobile apps should cache recent data and allow users to view dashboards, update records, and log activities offline. Changes should sync automatically when connectivity is restored.
Touch-optimized interface for field sales teams makes mobile interaction efficient and pleasant. Swipe gestures for moving deals between pipeline stages, long-press menus for quick actions, and voice input for logging notes all enhance mobile usability. The mobile experience should feel purpose-built for touch interaction, not like a desktop interface squeezed onto a small screen.
7. Consider Scalability and Performance
Your CRM dashboard needs to perform well not just today with your current data volume and team size, but also as your solar business grows. Scalability considerations often get overlooked during initial evaluation but become critical pain points later.
Dashboard load times with large datasets directly impact user experience and adoption. A dashboard that takes 30 seconds to load will frustrate users and discourage frequent checking. Ask vendors about performance benchmarks with datasets similar to what you’ll have in two or three years, not just your current volume.
Quality CRM systems use database optimization, caching, and efficient queries to maintain fast load times even with hundreds of thousands of records. Some systems offer data archiving features that move old closed deals to separate storage, keeping the active database lean and responsive.
Performance with growing team sizes is another scalability dimension. A dashboard that works well for five users might slow down significantly with fifty concurrent users. Understanding the system’s architecture and whether it’s built on scalable cloud infrastructure helps predict future performance.
Data retention and historical reporting limits vary significantly between CRM vendors. Some systems retain all historical data indefinitely, while others archive or delete old records after a certain period. For solar businesses that want to analyze multi-year trends and customer lifetime value, unlimited data retention is important.
Concurrent user access capabilities ensure your entire team can use the dashboard simultaneously without performance degradation. This is particularly important during peak times like Monday morning sales meetings when everyone is checking their weekly targets and pipeline status.
Future-proofing for business growth means choosing a CRM dashboard that can scale with you. Consider whether the system can handle multiple business units, additional product lines beyond solar, or expansion into new geographic territories. Understanding the upgrade path and whether you’ll need to migrate to a different platform as you grow helps avoid costly transitions later.
These scalability considerations are closely related to critical questions about CRM scalability that every buyer should ask before committing to a platform.
8. Ask Vendors These Critical CRM Dashboard Questions
Armed with knowledge about essential dashboard features, you’re ready to evaluate specific vendors. These targeted questions help you cut through marketing claims and understand real capabilities.
What metrics are available out-of-the-box versus requiring customization? This question reveals how much configuration work you’ll need to do before the dashboard becomes useful. Solar-specific CRM solutions should offer relevant metrics immediately, while generic CRMs might require extensive custom field creation and formula building.
How frequently does the dashboard update with new data? Get specific answers about refresh rates. Real-time means instant updates. Some vendors claim real-time but actually refresh every 15 minutes. Understanding the actual update frequency helps you set appropriate expectations.
Can we create custom reports without technical expertise? Ask for a demonstration of the report builder during the sales process. Have the vendor create a custom report based on your specific requirements while you watch. This reveals whether the tool is truly user-friendly or requires developer involvement for customization.
What training and support is provided for dashboard setup? Implementation support varies dramatically between vendors. Some provide dedicated onboarding specialists who help configure your dashboard. Others simply provide documentation and expect you to figure it out. Understanding the support model helps you estimate the true time and cost of getting started.
Are there additional costs for advanced analytics features? Pricing structures can be complex, with basic dashboards included in standard plans but advanced reporting, custom dashboards, or API access requiring premium tiers. Get complete pricing information including any per-user fees, data storage limits, or feature restrictions at different price points.
Understanding what you’re really paying for in CRM software helps you evaluate whether the dashboard capabilities justify the investment.
How does your dashboard compare to competitors in the solar industry? This question encourages vendors to differentiate themselves and often reveals unique capabilities or limitations. Pay attention to whether they compare features honestly or just make vague superiority claims.
Request references from other solar companies using the CRM dashboard. Speaking with current customers provides unfiltered insights about real-world performance, implementation challenges, and ongoing support quality that you won’t get from vendor marketing materials.
How QuickEst Delivers Dashboard Excellence for Solar Teams
QuickEst understands that solar businesses need CRM dashboard capabilities that are powerful yet simple, comprehensive yet focused on what actually matters for closing deals and growing revenue.

Real-time sales performance tracking built for solar businesses gives you instant visibility into your pipeline, team activities, and conversion metrics. The QuickEst dashboard updates live as your team logs activities, sends proposals, and closes deals. No waiting for overnight batch processing or manual data refreshes.
The platform displays the metrics that matter most for solar sales: proposal acceptance rates, follow-up completion rates, lead source performance, and revenue forecasts. These aren’t buried in complex menus; they’re front and center on your main dashboard view.
Intuitive analytics without complex setup means you can start getting value from your dashboard on day one, not after weeks of configuration. QuickEst comes pre-configured with solar-relevant metrics and reports. While customization options are available for businesses with unique needs, most solar companies find the default dashboard perfectly suited to their workflows.
The visual design prioritizes clarity over complexity. Color-coded pipeline stages, simple bar charts comparing team performance, and clear progress indicators toward goals make the dashboard accessible even for team members who aren’t data analysts.
Mobile-first dashboard design for field teams ensures your sales representatives have full CRM access whether they’re in the office or conducting site assessments. The QuickEst mobile app provides complete dashboard functionality with touch-optimized controls and offline access capabilities.
Field sales teams can check their daily follow-up list, view prospect details before meetings, send professional proposals via WhatsApp within 60 seconds, and update deal statuses immediately after customer conversations. This mobile capability keeps your CRM data current and actionable.
Integration with proposal generation and follow-up automation creates a unified workflow that many standalone CRM dashboards can’t match. QuickEst combines CRM dashboard analytics with rapid proposal creation and automated follow-up systems. This integration means your dashboard reflects complete sales activity, not just manually logged data.
When a sales representative sends a proposal through QuickEst, the dashboard automatically updates to show proposal sent, tracks when the customer opens it, and triggers automated follow-up sequences. This seamless connection between action and analytics eliminates data entry gaps that plague many CRM implementations.
Affordable pricing with comprehensive dashboard features makes enterprise-grade analytics accessible to solar businesses of all sizes. QuickEst offers a free plan to get started, with the Pro plan available at ₹6,999 per user per year. This pricing includes full dashboard access, unlimited proposals, and all core CRM features without hidden fees or feature restrictions.
For solar companies evaluating CRM options, QuickEst delivers the dashboard capabilities outlined in this guide without the complexity and cost of enterprise platforms designed for Fortune 500 companies. The platform is purpose-built for solar and B2B service businesses, which means the dashboard shows metrics that actually matter for your industry.
Implementing a new CRM system requires careful planning. Our step-by-step CRM implementation guide walks you through the process of getting your team up and running efficiently.
Making Your Final CRM Dashboard Decision
You’ve learned about essential dashboard features, evaluation criteria, and critical vendor questions. Now it’s time to make your decision and move forward with confidence.
Prioritizing must-have versus nice-to-have features helps you avoid analysis paralysis. Create a simple spreadsheet listing the dashboard capabilities discussed in this guide. Mark each as essential, important, or nice-to-have based on your specific business needs. This prioritization framework makes vendor comparison much more objective.
For most solar businesses, must-have features include real-time pipeline visibility, mobile access, lead source tracking, and team performance metrics. Nice-to-have features might include advanced forecasting algorithms or white-label branding. Focus on vendors that excel at your must-haves rather than those offering the longest feature list.
Testing dashboards with real solar sales data reveals usability issues that demos with sample data might hide. Most quality CRM vendors offer free trials or pilot programs. Take advantage of these to import some of your actual lead data and have your team use the dashboard for real work, not just exploration.
Pay attention to how quickly team members adapt to the new dashboard. If they’re constantly asking how to find specific information or complaining about confusing layouts, that’s a red flag. The best dashboards feel intuitive even to users who aren’t particularly tech-savvy.
Considering total cost of ownership including training provides a more accurate picture than just comparing subscription prices. A cheaper CRM that requires extensive customization, ongoing technical support, and lengthy training might ultimately cost more than a slightly pricier solution that works well out-of-the-box.
Factor in the value of your team’s time during implementation. If getting your dashboard configured and your team trained takes three months with one vendor versus two weeks with another, that time difference has real business impact in terms of lost productivity and delayed benefits.
Getting team buy-in and feedback during evaluation dramatically improves adoption rates after purchase. Include sales representatives, sales managers, and other stakeholders in the evaluation process. Let them test different dashboards and provide input on which interfaces they find most helpful.
When team members feel ownership over the CRM selection decision, they’re much more likely to embrace the new system enthusiastically rather than resist change. Their frontline perspective also helps identify practical usability issues that leadership might overlook.
Starting with the right dashboard foundation for growth sets your solar business up for long-term success. The CRM dashboard you choose today will likely serve your business for years. Selecting a scalable platform that can grow with you avoids the pain and expense of migrating to a new system as your needs evolve.
The right CRM dashboard transforms how your solar business operates. It replaces guesswork with data-driven insights, eliminates manual reporting work, and empowers your team to focus on high-value activities that actually close deals. Real-time visibility into your sales pipeline, team performance, and conversion metrics gives you the competitive advantage needed to thrive in India’s growing solar market.
Ready to experience a CRM dashboard built specifically for solar businesses? QuickEst offers the analytics, reporting, and real-time visibility you need without overwhelming complexity or enterprise-level costs. Explore our free plan to get started, or discover how the Pro plan at ₹6,999 per user per year delivers comprehensive dashboard capabilities that help solar teams close more deals faster. See firsthand how the right CRM dashboard can unlock your sales potential and drive measurable growth in 2026.
This blog post was written using thestacc.com