
For solar EPC companies and installers across India, predicting revenue isn’t just about numbers on a spreadsheet—it’s about making confident decisions that determine whether your business thrives or struggles. Should you hire two more sales engineers next quarter? Can you commit to that bulk panel order? Will you have enough cash flow to cover project expenses in three months?
Without accurate sales forecasting, these critical questions become expensive gambles. Yet many solar businesses still rely on gut feelings, outdated spreadsheets, or overly optimistic projections that crumble when reality hits. The good news? Modern CRM systems and data-driven methodologies have transformed sales forecasting from guesswork into a reliable science that solar companies can master.
This comprehensive guide walks you through proven sales forecasting techniques specifically designed for solar businesses in 2026. You’ll learn how to leverage your CRM data, track the right metrics, choose appropriate forecasting methodologies, and create reliable monthly and quarterly projections that drive smarter business decisions.
Why Sales Forecasting Matters for Solar Companies in 2026
The solar industry operates with unique challenges that make accurate sales forecasting absolutely essential. Unlike retail businesses with quick transactions, solar projects involve lengthy sales cycles—often spanning 30 to 90 days from initial contact to signed contract. Add in site surveys, technical proposals, financing approvals, and installation scheduling, and you’re managing a complex pipeline that demands careful tracking.
Poor sales forecasting creates a domino effect of problems: You might hire salespeople when your pipeline can’t support them, leading to wasted salary expenses. Or you might delay hiring when opportunity is knocking, losing market share to competitors. Inventory decisions become risky—order too many panels and you tie up capital in storage; order too few and you can’t fulfill contracts on time.
Cash flow management becomes particularly tricky for solar EPCs. Projects require upfront investments in equipment and labor before you receive full payment. Without accurate revenue predictions, you might find yourself cash-strapped despite having a healthy pipeline, unable to take on new projects even when demand is strong.
Here’s where CRM data transforms everything. Instead of relying on sales team optimism or rough estimates, a properly configured solar CRM system captures every interaction, tracks proposal status, monitors follow-up activities, and provides real-time visibility into your entire pipeline. This data becomes the foundation for forecasting that actually reflects reality.
According to industry research, companies with accurate sales forecasting are 10% more likely to grow revenue year-over-year and 7.3% more likely to hit quota. For solar businesses operating in India’s rapidly evolving renewable energy market, these advantages can mean the difference between leading your region and struggling to compete.
1. Understand Your Solar Sales Pipeline Stages
Before you can forecast revenue accurately, you need a clearly defined pipeline that reflects how solar deals actually progress through your sales process. Generic pipeline stages won’t cut it—your stages must match the specific journey your customers take from initial inquiry to signed contract.
A typical solar sales pipeline includes these stages:
- Lead Captured: Initial contact through website, referral, or marketing campaign
- Qualified Prospect: Lead has confirmed interest, budget, and decision-making authority
- Site Survey Scheduled: Technical assessment appointment set
- Proposal Sent: Detailed solar system proposal delivered to customer
- Negotiation: Customer reviewing proposal, discussing terms, or requesting modifications
- Verbal Commitment: Customer has agreed in principle, awaiting final paperwork
- Closed Won: Contract signed and deposit received
- Closed Lost: Deal did not proceed (track reasons for future improvement)
The critical step for sales forecasting is assigning probability percentages to each stage based on your historical conversion data. For example, if 60% of prospects who receive proposals eventually become customers, your “Proposal Sent” stage gets a 60% probability weight.
Track how long deals typically spend in each stage. If prospects sit in “Negotiation” for more than two weeks, that’s a signal the deal might be cooling off. This timing data helps you identify which opportunities are progressing normally versus which ones need intervention or should be downgraded in your forecast.
Many solar companies using properly implemented CRM systems discover that their assumed conversion rates were wildly inaccurate. Real data often reveals that certain stages have much lower conversion than sales teams believed, leading to more conservative and ultimately more accurate forecasts.
2. Choose the Right Sales Forecasting Methodology
Solar businesses have several proven methodologies to choose from when building sales forecasting models. The best approach often combines multiple methods to create a comprehensive view of expected revenue. Let’s explore the three most effective techniques for solar EPCs and installers.
Pipeline-Based Forecasting for Solar Sales
This methodology uses your current pipeline data combined with stage probability percentages to calculate expected revenue. It’s the most common approach for B2B solar sales because it provides a realistic view based on actual opportunities in progress.
Here’s how it works: Multiply each deal’s value by its stage probability, then sum all weighted values to get your forecasted revenue. For example, if you have a ₹15 lakh residential solar project in the “Proposal Sent” stage with a 60% probability, it contributes ₹9 lakh to your forecast.
The formula is straightforward: Forecasted Revenue = Σ (Deal Value × Stage Probability)
Let’s walk through a practical example for a solar company’s monthly forecast:
- Deal A: ₹25 lakh commercial project, Negotiation stage (75% probability) = ₹18.75 lakh
- Deal B: ₹12 lakh residential project, Proposal Sent (60% probability) = ₹7.2 lakh
- Deal C: ₹8 lakh residential project, Proposal Sent (60% probability) = ₹4.8 lakh
- Deal D: ₹30 lakh industrial project, Qualified Prospect (30% probability) = ₹9 lakh
- Deal E: ₹10 lakh residential project, Verbal Commitment (90% probability) = ₹9 lakh
Total Monthly Forecast: ₹48.75 lakh
This pipeline-based approach works exceptionally well when your CRM data is clean and updated regularly. Systems like QuickEst automatically track proposal status and deal progression, ensuring your forecast calculations reflect current reality rather than outdated information.
Historical Trend Analysis
This methodology examines past performance to predict future results. It’s particularly valuable for solar companies because it captures seasonal patterns that significantly impact the industry.
Solar sales in India typically see increased activity during certain months, often spiking before monsoon season when customers want installations completed, and again during festival seasons when businesses make capital investments. By analyzing your sales data from previous years, you can identify these patterns and adjust your forecasts accordingly.
Calculate year-over-year growth rates to establish baseline expectations. If your solar business closed ₹2.5 crore in Q1 2025 and ₹3 crore in Q1 2026, that’s 20% growth. Applying this growth rate to historical patterns gives you a reasonable forecast for Q1 2027.
However, be cautious about blindly applying historical trends. The solar industry in India is evolving rapidly with changing subsidy policies, net metering regulations, and competitive dynamics. Always adjust historical forecasts to account for known market changes, new competitors entering your territory, or policy shifts that might impact demand.
Opportunity-Based Forecasting
This approach involves individual assessment of each deal based on specific characteristics beyond just pipeline stage. Your sales team evaluates factors like customer engagement level, budget confirmation, decision timeline, and competitive situation to assign a custom probability to each opportunity.
For solar businesses, opportunity-based forecasting works well for large commercial or industrial projects where each deal is unique. A ₹50 lakh commercial installation for a repeat customer with confirmed financing might get a 95% probability even if it’s technically still in the “Proposal Sent” stage, while a similar-sized deal with a new customer who’s also talking to three competitors might only warrant 40% probability.
The challenge with this method is it requires experienced sales judgment and can introduce bias if salespeople are overly optimistic. Combining opportunity-based assessment with pipeline-based calculations creates a balanced forecast that leverages both data and expertise.
3. Track the Right Metrics for Accurate Sales Forecasting
Accurate sales forecasting depends on monitoring specific metrics that reveal how your solar sales engine actually performs. These key performance indicators become the building blocks of reliable revenue predictions.
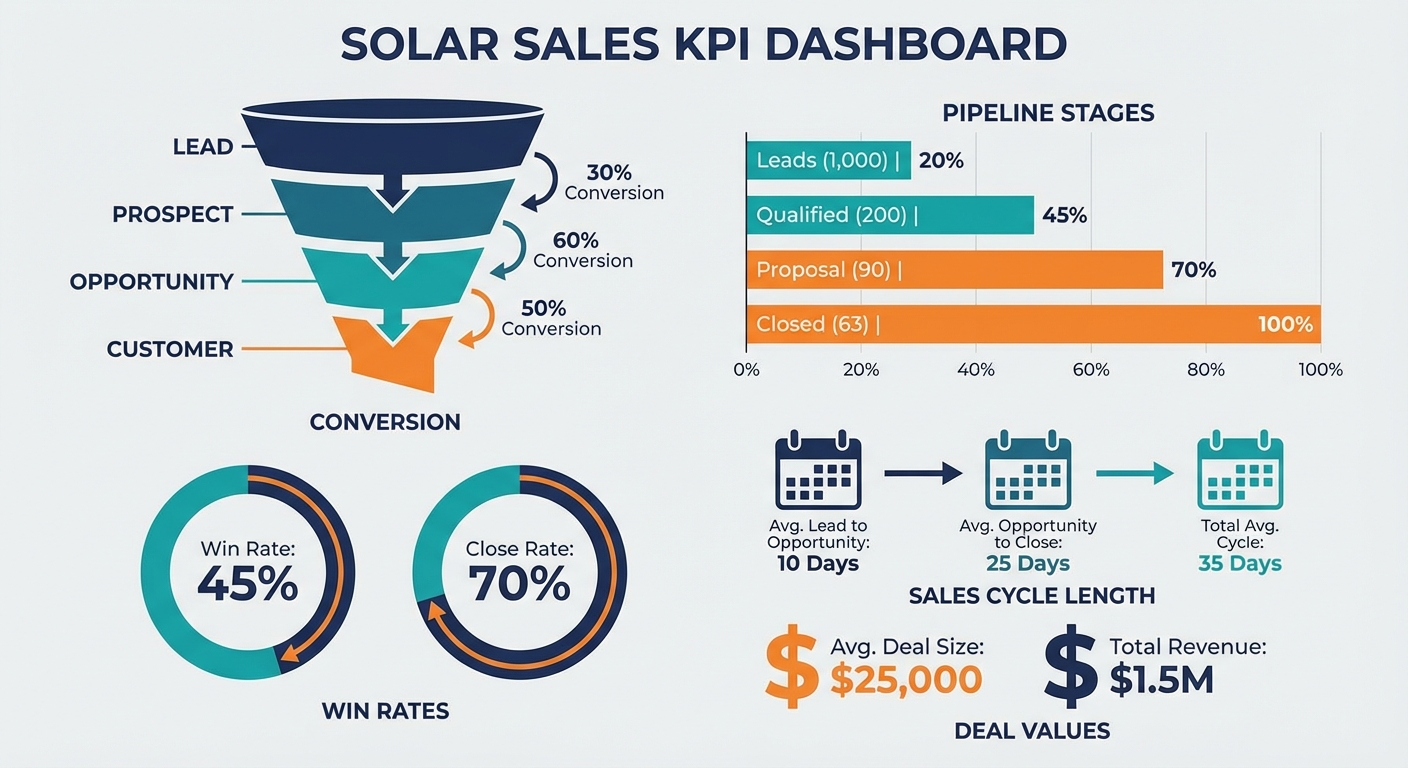
Lead-to-Opportunity Conversion Rate: What percentage of initial leads become qualified opportunities worth pursuing? If you capture 100 leads monthly but only 25 turn into real prospects, that’s a 25% conversion rate. This metric helps you predict how many opportunities will enter your pipeline based on marketing activities.
Average Deal Size: Track the typical value of residential versus commercial versus industrial solar projects. Knowing your average residential project is ₹8-12 lakh while commercial projects average ₹25-40 lakh allows you to forecast revenue based on the mix of opportunities in your pipeline. Many solar companies discover their average deal size increases over time as they gain experience and credibility, which should be factored into forward-looking forecasts.
Sales Cycle Length: Measure the average time from first contact to closed deal. For most solar installers, residential projects close in 30-45 days while commercial projects take 60-90 days. Understanding these timelines helps you forecast when pipeline opportunities will convert to actual revenue. A deal that entered your pipeline yesterday won’t close this month, it needs to progress through your typical cycle.
Win Rate by Pipeline Stage: This is different from stage probability, it measures what percentage of deals that reach each stage ultimately close. If 80% of deals that reach “Verbal Commitment” eventually close, but only 45% of deals that reach “Proposal Sent” close, you know where your conversion bottlenecks exist. These win rates should inform your probability assignments for sales forecasting.
Pipeline Velocity: How quickly do deals move through your pipeline? Calculate this by measuring the average time spent in each stage. Faster velocity means you can close more deals in a given period, directly impacting revenue forecasts. If your pipeline velocity increases from 60 days to 45 days, you can forecast higher monthly revenue even with the same number of opportunities.
Monthly Recurring Revenue (MRR) for O&M Contracts: Many solar companies now offer operations and maintenance contracts that provide predictable recurring revenue. Track this separately from project revenue since it’s highly predictable and provides a stable baseline for your forecasts.
Modern solar CRM platforms automatically calculate these metrics from your pipeline data, eliminating manual tracking and reducing errors. When your CRM captures every proposal sent, every follow-up completed, and every deal closed, these metrics update in real-time to reflect current performance.
4. Leverage CRM Data for Revenue Predictions
Your CRM system is a goldmine of forecasting data, if you’re using it properly. The difference between accurate and wildly inaccurate sales forecasting often comes down to how well you capture and utilize CRM information.
Real-time pipeline visibility is the foundation. When every salesperson updates deal status, records customer interactions, and logs proposal outcomes in your CRM, you have a living, breathing view of your sales reality. This eliminates the guesswork that comes from asking salespeople “What do you think will close this month?” and instead provides objective data about what’s actually happening.
Proposal tracking becomes particularly powerful for solar businesses. When your CRM integrates with your proposal generation tool, like QuickEst’s 60-second proposal system, you automatically capture when proposals are sent, when customers view them, and how long they take to respond. This behavioral data reveals deal temperature better than any salesperson’s gut feeling.
Follow-up activity tracking shows which deals are actively progressing versus which are stalling. A prospect who hasn’t responded to three follow-up attempts in two weeks probably shouldn’t carry the same forecast weight as one who’s actively engaging with your team and asking detailed technical questions.
Team performance data helps with capacity planning and forecasting. If your top salesperson closes ₹40 lakh monthly while newer team members average ₹15 lakh, you can forecast total team capacity by multiplying individual performance by headcount. This becomes critical when deciding whether to hire additional salespeople, you can forecast the revenue impact before making the investment.
Integration capabilities extend your forecasting power beyond the CRM itself. When your solar CRM connects with your accounting system, you can compare forecasted revenue against actual invoiced amounts to continuously refine your predictions. Integration with marketing platforms shows how lead generation activities impact pipeline growth, helping you forecast future opportunity flow.
The key is data hygiene. Garbage in, garbage out applies perfectly to sales forecasting. Establish clear processes for keeping CRM records updated, removing dead leads, and accurately reflecting deal status. Many solar companies conduct weekly pipeline reviews where sales managers verify that every opportunity is properly categorized and probability-weighted. This discipline pays dividends in forecast accuracy.
Companies using comprehensive CRM integration strategies report significantly more accurate forecasts because data flows automatically between systems, reducing manual entry errors and ensuring consistency across all business functions.
5. Create Monthly and Quarterly Forecast Reports
Building structured forecast reports transforms raw CRM data into actionable business intelligence. Here’s a step-by-step process for creating reliable monthly and quarterly sales forecasting reports for your solar business.
Step 1: Pull Current Pipeline Data
Export all open opportunities from your CRM with their current stage, deal value, probability percentage, and expected close date. Filter by the time period you’re forecasting, for a monthly forecast, include all deals expected to close within the next 30 days.
Step 2: Calculate Weighted Pipeline Value
Apply your stage probability percentages to each deal and sum the weighted values. This gives you your “most likely” forecast scenario. For example, if your weighted pipeline for March totals ₹65 lakh, that’s your baseline forecast.
Step 3: Create Best-Case and Worst-Case Scenarios
Build three forecast scenarios to account for uncertainty. Your best-case scenario might assume all deals in “Negotiation” or later stages close (higher probabilities), while worst-case assumes only “Verbal Commitment” deals close (lower probabilities). This range helps you plan for different outcomes.
Example three-scenario forecast for a solar company:
- Best Case: ₹85 lakh (assumes strong conversion and some deals closing faster than expected)
- Most Likely: ₹65 lakh (weighted pipeline calculation)
- Worst Case: ₹45 lakh (assumes some deals slip to next month and lower conversion)
Step 4: Account for New Business
Your current pipeline doesn’t include deals that will enter and close within the forecast period. Based on historical data, estimate how much new business typically enters and closes within a single month. If you historically close ₹10-15 lakh from deals that weren’t in your pipeline at month-start, add this to your forecast.
Step 5: Adjust for Seasonal Factors
Apply seasonal adjustments based on historical patterns. If March is typically 20% stronger than February for your solar business due to pre-summer installation demand, factor this into your projections.
Step 6: Review with Sales Team
Present your data-driven forecast to your sales team and ask for qualitative input. Are there external factors not captured in the data? Has a major competitor left the market? Is a new subsidy program launching? Incorporate this intelligence into your final forecast.
For quarterly forecasts, follow the same process but extend your time horizon and add more conservative probability adjustments for deals expected to close 60-90 days out. The further into the future you forecast, the more uncertainty exists, so build in wider ranges between your best-case and worst-case scenarios.
Document your forecasting methodology and assumptions. When you compare actual results against forecasts, you’ll identify which assumptions were accurate and which need adjustment, continuously improving your forecasting accuracy over time.
6. Implement Best Practices for Reliable Sales Forecasting
Consistent execution of best practices separates solar companies with accurate forecasts from those constantly surprised by revenue shortfalls. These proven techniques ensure your sales forecasting remains reliable month after month.

Conduct Weekly Pipeline Reviews: Schedule recurring meetings where sales managers review every significant opportunity with team members. Verify that deal stages accurately reflect reality, update close dates based on customer conversations, and adjust probability percentages when circumstances change. These reviews keep your CRM data fresh and your forecasts accurate.
Maintain Rigorous Data Hygiene: Establish clear rules for CRM data entry and enforce them consistently. Every deal must have a realistic close date, accurate value, and current stage. Remove or archive dead leads promptly, they clutter your pipeline and inflate forecasts. Set up automated reminders for salespeople to update stale opportunities that haven’t been touched in two weeks.
Use Automation to Reduce Manual Errors: Manual forecasting in spreadsheets introduces calculation mistakes and version control nightmares. Modern solar CRM systems like QuickEst automatically calculate weighted pipeline values, track conversion metrics, and generate forecast reports with a few clicks. This automation eliminates human error and saves hours of administrative work.
Automated follow-up systems also improve forecast accuracy by ensuring no opportunities fall through the cracks due to missed follow-ups. When your CRM automatically reminds salespeople to contact prospects and logs all interactions, your pipeline data reflects genuine engagement levels.
Account for External Factors: Solar businesses operate in a dynamic environment influenced by government policies, subsidy programs, net metering regulations, and seasonal weather patterns. Build a practice of reviewing upcoming policy changes, competitor activities, and market conditions when creating forecasts. If you know a major subsidy program expires next month, expect a surge in deals closing before the deadline followed by a potential slowdown.
Track Forecast Accuracy and Learn: Compare your forecasted revenue against actual closed revenue every month. Calculate your forecast accuracy percentage and identify patterns in your errors. Do you consistently over-forecast? Are certain deal types less predictable than others? Use these insights to refine your probability percentages and methodology.
Separate New Business from Renewals/Upsells: If your solar company offers O&M contracts, system expansions, or repeat business from existing customers, forecast these separately from new customer acquisition. Repeat business typically has higher close rates and shorter sales cycles, so mixing it with new business in a single forecast can skew your predictions.
Involve Multiple Stakeholders: Don’t let sales forecasting happen in isolation. Share forecasts with operations teams who need to plan installation capacity, procurement teams managing inventory, and finance teams handling cash flow. Their feedback often reveals constraints or opportunities that should influence your projections.
7. Use Forecasts to Make Strategic Business Decisions
Accurate sales forecasting transforms from a reporting exercise into a strategic tool that drives smarter business decisions across your solar company. Here’s how to leverage your revenue predictions for maximum impact.

Hiring Decisions: Your sales forecast reveals whether you have capacity to support additional salespeople. If your current team is consistently hitting capacity and your pipeline shows strong demand, you can confidently invest in hiring. Calculate the break-even point, how much additional revenue does a new salesperson need to generate to cover their salary and expenses? If your forecast shows sufficient opportunity, pull the trigger on expansion.
Conversely, if your forecast shows a softening pipeline, you might delay hiring and instead focus on improving conversion rates with your existing team. This prevents the costly mistake of adding headcount just as market conditions weaken.
Inventory and Equipment Planning: Solar EPCs need to order panels, inverters, and mounting systems well before installation. Your sales forecast tells you how much equipment you’ll need in the coming months. A forecast showing ₹2 crore in projects closing over the next quarter allows you to calculate required panel quantities and place orders with appropriate lead time.
This prevents two expensive problems: tying up capital in excess inventory that sits in storage, or scrambling to source equipment at premium prices when a deal closes faster than expected. Smart inventory planning based on accurate forecasts improves cash flow and project margins.
Cash Flow Management: Solar projects require upfront investment in materials and labor before you receive full payment from customers. Your sales forecast combined with your payment terms tells you exactly when cash will flow in and when major expenses will occur. This allows you to arrange financing, manage vendor payments, and avoid cash crunches that could prevent you from taking on new projects.
If your forecast shows ₹80 lakh in revenue closing next month but ₹60 lakh in project expenses due, you know you’ll have positive cash flow. But if expenses exceed forecasted revenue, you can arrange a line of credit or adjust payment terms before problems arise.
Marketing Budget Allocation: Your forecast reveals pipeline gaps that marketing should fill. If your forecast shows strong near-term revenue but a weak pipeline for 60-90 days out, it’s time to increase lead generation activities now. Conversely, if your pipeline is overflowing and salespeople are at capacity, you might temporarily reduce marketing spend and focus on conversion instead.
Track the relationship between marketing investment and pipeline growth. If ₹50,000 in Facebook advertising typically generates ₹15 lakh in pipeline value within 60 days, you can forecast the revenue impact of marketing budget changes and optimize your spending.
Growth Strategy and Market Expansion: Consistent sales forecasting over time reveals trends that inform strategic decisions. If your residential solar business shows steady 15% quarterly growth while commercial projects remain flat, you might decide to double down on residential marketing or investigate why commercial isn’t growing. Geographic analysis of your pipeline might reveal that certain districts show stronger demand, suggesting where to focus expansion efforts.
Investors and lenders also want to see reliable sales forecasting when you’re seeking capital for growth. A solar company that can demonstrate accurate forecasting track record and show a strong forward pipeline has a much easier time securing funding than one operating on gut feelings and optimism.
Common Sales Forecasting Mistakes Solar Companies Make
Even with the best intentions, solar businesses often fall into predictable forecasting traps. Recognizing these common mistakes helps you avoid them.
Over-Optimistic Projections Without Historical Data: New solar companies often forecast based on how many deals they hope to close rather than realistic conversion rates. If you’ve never closed more than ₹50 lakh in a month, forecasting ₹1 crore next month without major changes to your sales capacity is wishful thinking. Always ground forecasts in actual historical performance, then adjust incrementally for improvements.
Ignoring Seasonal Fluctuations: Solar demand in India varies significantly by season. Monsoon months often see slower sales as customers delay installations, while pre-summer and post-monsoon periods typically surge. Forecasting March revenue based on January performance without accounting for seasonal patterns leads to significant errors. Build seasonality into your models based on at least one full year of historical data.
Not Updating Forecasts as Deals Progress: Your forecast shouldn’t be a static document created once per month. As deals move through your pipeline, close, or fall out, your forecast should update accordingly. Many solar companies create a forecast on the 1st of the month and never revisit it, even as major deals slip or unexpected opportunities close. Implement rolling forecasts that refresh weekly based on current pipeline status.
Relying on Spreadsheets Instead of CRM Analytics: Manual spreadsheet forecasting is time-consuming, error-prone, and quickly becomes outdated. When your sales team updates deals in the CRM but forecasts are built in separate spreadsheets, the two systems diverge and accuracy suffers. Modern solar CRM platforms provide built-in forecasting tools that automatically calculate weighted pipeline values and update in real-time as deals progress.
Companies that invest in proper CRM solutions report significantly better forecast accuracy because their data stays synchronized and calculations happen automatically.
Failing to Account for Long Solar Sales Cycles: A common mistake is forecasting that a lead captured today will close this month. Solar sales cycles typically run 30-90 days depending on project type. Your forecast should only include opportunities that have progressed far enough through your pipeline to realistically close within the forecast period. Deals in early stages belong in future forecasts, not current month projections.
Not Tracking Forecast Accuracy: If you never compare forecasted revenue against actual results, you can’t improve your methodology. Many solar companies create forecasts but never circle back to measure accuracy. This prevents learning and perpetuates the same forecasting errors month after month. Make forecast accuracy review a standard part of your monthly business review process.
Ignoring Deal Velocity Changes: Your sales cycle length isn’t static. As your team gains experience, as you improve your proposal process, or as market conditions change, deals may move faster or slower through your pipeline. If your average sales cycle has shortened from 60 days to 45 days but you’re still using 60-day assumptions in your forecasts, you’ll consistently under-predict revenue. Monitor velocity metrics and adjust forecasts accordingly.
Start Forecasting Smarter with the Right Tools
Implementing accurate sales forecasting doesn’t require expensive enterprise software or a data science team. The right CRM platform designed specifically for solar businesses provides everything you need to predict revenue reliably and make confident business decisions.
QuickEst transforms sales forecasting for solar EPCs and installers by automatically capturing the data that drives accurate predictions. When your team generates proposals in 60 seconds and sends them directly through the platform, every proposal is tracked, when it was sent, when the customer viewed it, and what happened next. This eliminates the manual data entry that causes forecasting errors in traditional systems.
The platform’s real-time analytics dashboard shows your complete pipeline at a glance, with deals organized by stage and weighted by probability. You can instantly see your forecasted revenue for the month, identify which opportunities need attention, and spot trends that might impact future performance. No more spending hours building spreadsheet forecasts, the data updates automatically as your team works.
Automated follow-up systems ensure no opportunity falls through the cracks, which directly improves forecast reliability. When prospects receive timely, consistent follow-ups, deals progress predictably through your pipeline instead of stalling unexpectedly. This consistency makes your conversion rates more stable and your forecasts more accurate.
Team collaboration features let sales managers review pipeline health with their teams, verify deal status, and ensure CRM data reflects reality. When everyone works in a single system with clear visibility, data hygiene improves naturally and forecasts stay grounded in truth rather than optimism.
For solar companies serious about growth, accurate sales forecasting isn’t optional, it’s the foundation of strategic planning, resource allocation, and confident decision-making. The difference between guessing and knowing your revenue trajectory determines whether you can seize opportunities or watch them pass by.
Ready to transform your sales forecasting from guesswork to science? QuickEst provides solar businesses with the CRM tools, analytics, and automation needed to predict revenue accurately and grow with confidence. Whether you’re a small installer handling a dozen projects monthly or a growing EPC managing hundreds of opportunities, the platform scales with your business.
Start building more accurate sales forecasting today. Explore QuickEst’s FREE PLAN – ₹0 to experience how automated proposal tracking and real-time pipeline visibility improve your revenue predictions. For teams ready to unlock advanced analytics and forecasting capabilities, the PRO PLAN – ₹6999 Per User / Year delivers comprehensive tools that drive smarter business decisions. Take control of your solar business growth with data-driven sales forecasting that actually works.
Questions about implementing sales forecasting for your solar company? Contact us to discuss how QuickEst can help you predict revenue accurately and make confident strategic decisions in 2026 and beyond.
This blog post was written using thestacc.com